




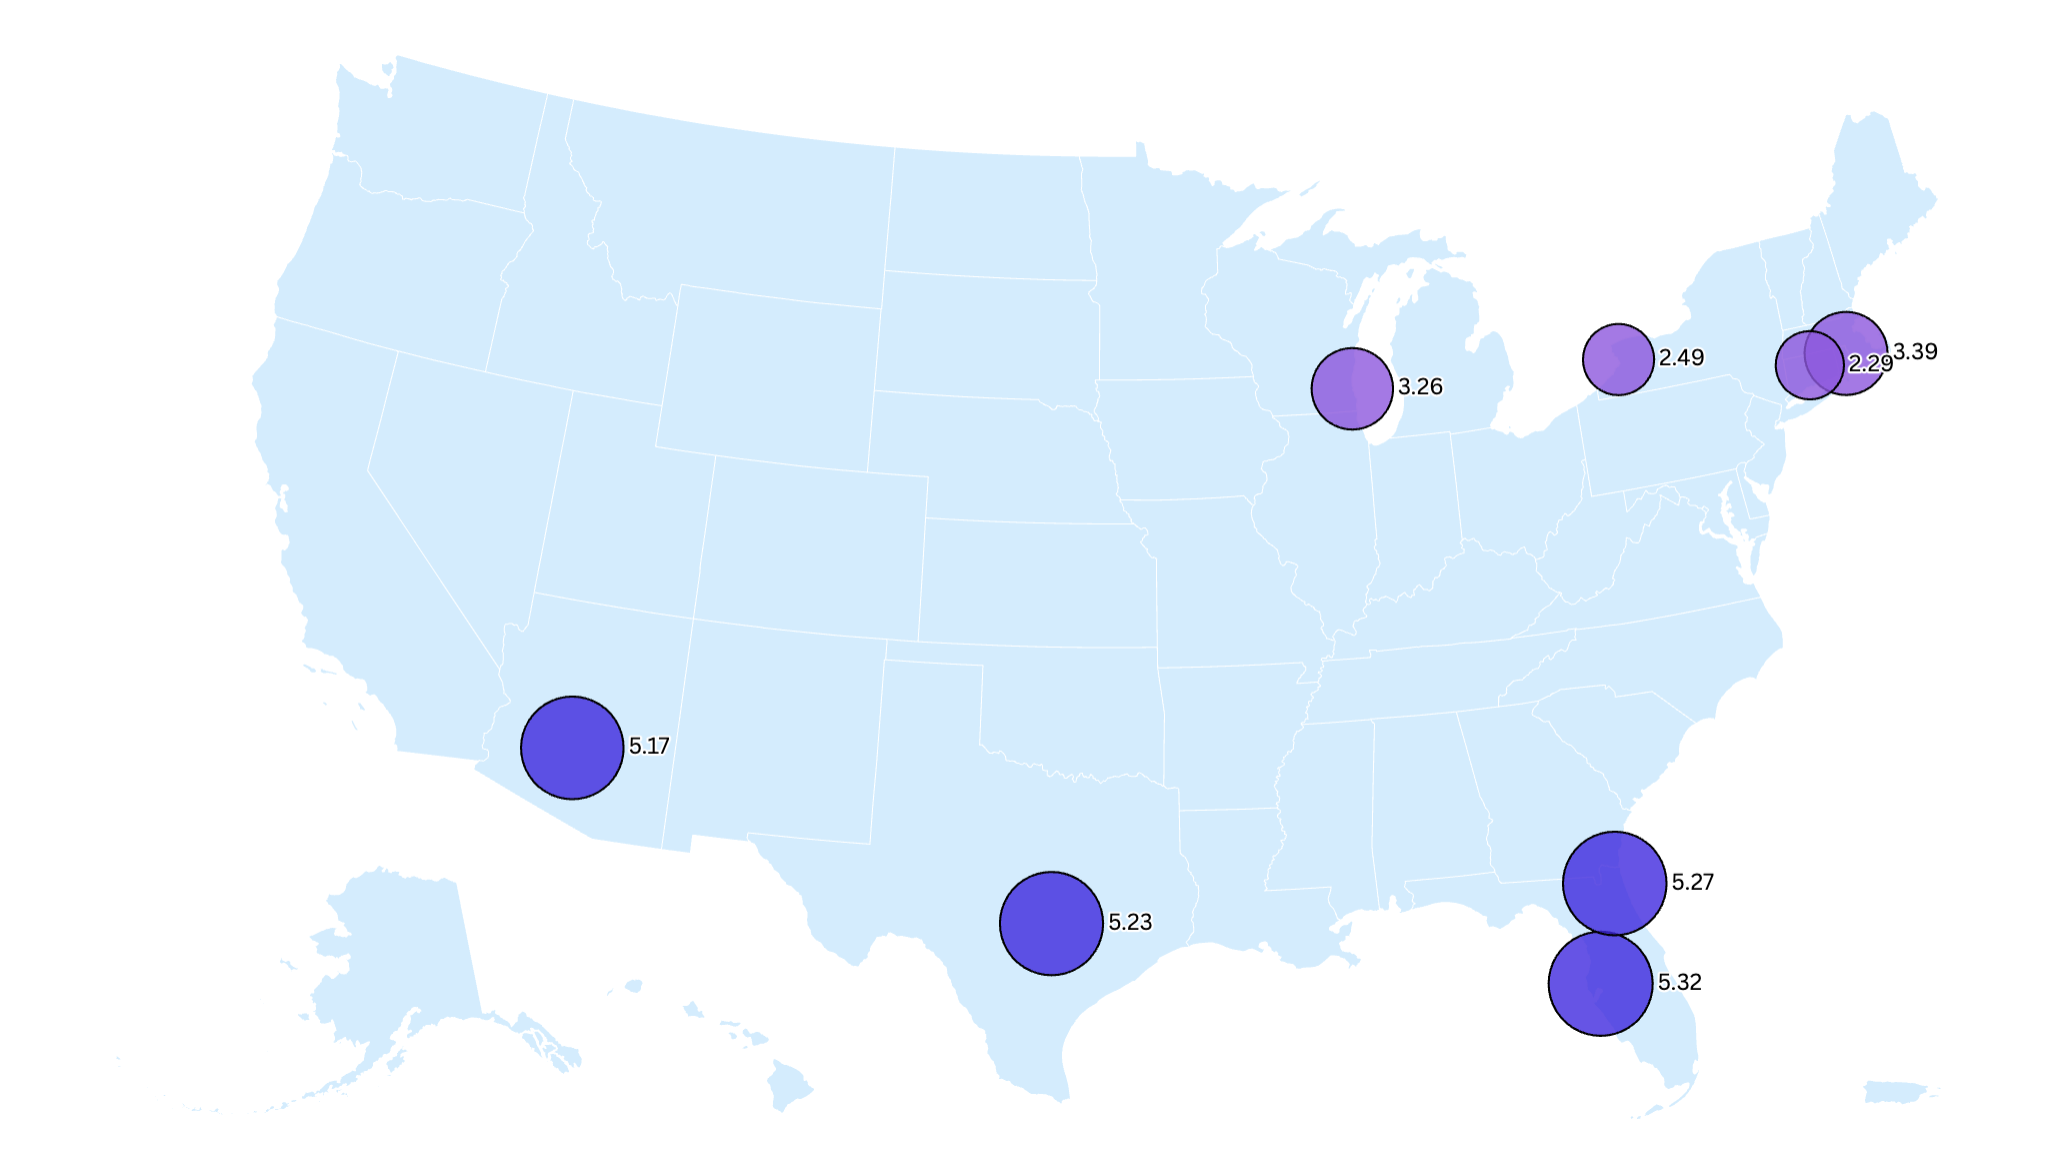
The U.S. housing market is splitting in two, with markets in the South and West facing a steep price correction after inventory recently ballooned and the Midwest and Northeast continuing to see stark competition among buyers as the supply of homes remains low.
A new report by real-estate intelligence platform Parcl Labs found that sellers in the South are between 20 percent and 30 percent more motivated than in the North, as they try to off-load their properties in the oversaturated Sun Belt markets.
“It’s a fundamental supply-demand imbalance. We’ve tracked this dynamic for over a year,” Parcl Labs told Newsweek. “In Sun Belt markets like Florida and Texas where home prices soared during the pandemic, there’s now more supply than demand—sellers are competing for fewer buyers. The opposite is true in Northeast markets where inventory remains tight and sellers still have pricing power.”
The Markets Where Homebuyers Have Most and Least Power Over Sellers
Parcl Labs created a Motivated Seller Index (MSI) on which to measure seller urgency on each market. Based on days spent by a listing on the market before going under contract, the frequency of price cuts and the speed at which they are introduced, together with their size, each market is given an MSI rating from 0 to 10.
“Homebuyers have leverage in markets where sellers are motivated. When Parcl Labs’ motivated seller index is high, it means listings are sitting longer on the market and sellers are actively cutting prices to find buyers,” Parcl Labs said.
In June, a list of the top 20 markets with the most motivated sellers in the country was dominated by Florida, a state which has seen some of the most dramatic price corrections in the country in recent months, with 14 metropolitan areas.
Two months later, the situation has changed: Florida is still very much on the list in August—but it is no longer alone. With the Sunshine State’s pandemic boomtowns, we have other cities where demand exploded in the aftermath of COVID-19, leading to a massive uptick in prices.
Tampa, Florida, currently tops the list of the top 50 U.S. metros for seller motivation, ranked by Parcl Labs at 4.92 MSI, with active listings averaging 74 days on market and 4 percent price cuts.
“In Tampa, we’re seeing individual listings with 10+ price cuts and over $100,000 off—and still not moving,” Parcl Labs told Newsweek. “For buyers, that translates to more inventory to choose from and sellers willing to negotiate. It’s a buyer’s market in much of the South right now.”
Tampa is followed by Austin, TX, Jacksonville, FL, and Phoenix, AZ, where the ongoing home price correction has “no floor in sight,” according to Parcl Labs. In both Jacksonville and Austin, listings spend an average 74 days on the market before going under contract, but where the typical price cut is of 3 percent in the Florida city, the Texas capital sees price cuts of about 4 percent.
In the Phoenix metropolitan area, listings clear after 71 days on the market, with the typical price cut at 3 percent of the original asking price.
Why the Divide?
At a regional level, the most motivated sellers are almost all on the South Atlantic coast—including the District of Columbia, Delaware, Florida, Georgia, Maryland, North Carolina, South Carolina, Virginia, and West Virginia)—with a score of 4.17. Here, listings spent an average of 67 days on the market before going under contract and have an average price reduction of 2.9 percent.
The second and third most motivated sellers are in the East South Central—including Alabama, Kentucky, Mississippi, and Tennessee—and West South Central, including Arkansas, Louisiana, Oklahoma, and Texas—with a score of 4.11 and 4.04, respectively.
In the East South Central, listings spent 66 days on average on the market before being sold and price cuts are an average 3 percent; in the West South Central, listings spent an average of 69 days on the market and price cuts are also 3 percent.
Pacific and Mountain regions had scores of 3.97 and 3.93, respectively, following the South closely in terms of seller urgency.
At the very bottom, with the least urgency, we have the North—and particularly New England, with a score of 3.28. Listings in these markets—including Connecticut, Massachusetts, Maine, New Hampshire, Rhode Island, and Vermont—sold within 54 days and had a modest average price cut of 2.4 percent.
This regional divide tells a story of supply and demand. Where supply is higher—for example, in the South, where many markets have experienced a construction boom in recent years leading to an explosion in new listings—sellers have to lower their asking prices to emerge over the competition.
Where supply is low—either because homeowners are locked in by lower mortgage rates or because not as many homes have been built in recent years—and demand is still high, home prices continue to grow.
At the national level, however, demand is shrinking as buyers’ ambitions are crushed by stubbornly elevated mortgage rates, sky-high home prices, and other rising costs, including home insurance premiums, property taxes, and homeowner association fees.
While the regional divide within the U.S. housing market is likely to continue, affordability is improving across the country for all buyers as inventory climbs amid dwindling sales. According to recently released preliminary data by nonpartisan libertarian think tank American Enterprise Institute, home price growth reached its lowest point in over a decade last month, at 1.8 percent.
What Comes Next?
According to Parcl Labs, new construction projects for single-family homes are showing elevated seller motivation across many markets.
“This trend is significant because homebuilders have tools to move homes that regular sellers don’t: mortgage rate buydowns, special financing, and other incentives,” Parcl Labs told Newsweek. “Our motivated seller index tracks days on market and price cuts—not those preliminary strategies. So when builders register high motivation scores, it suggests they’ve already exhausted their incentive toolkit and are cutting prices as a last resort.
“We first identified this pattern in Austin over a year ago, and it remains a top market for new construction stress. In markets that experienced substantial building activity, we expect this supply overhang will take time to clear.”
Read the full article here