
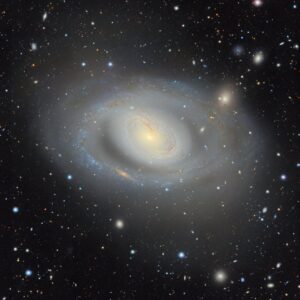



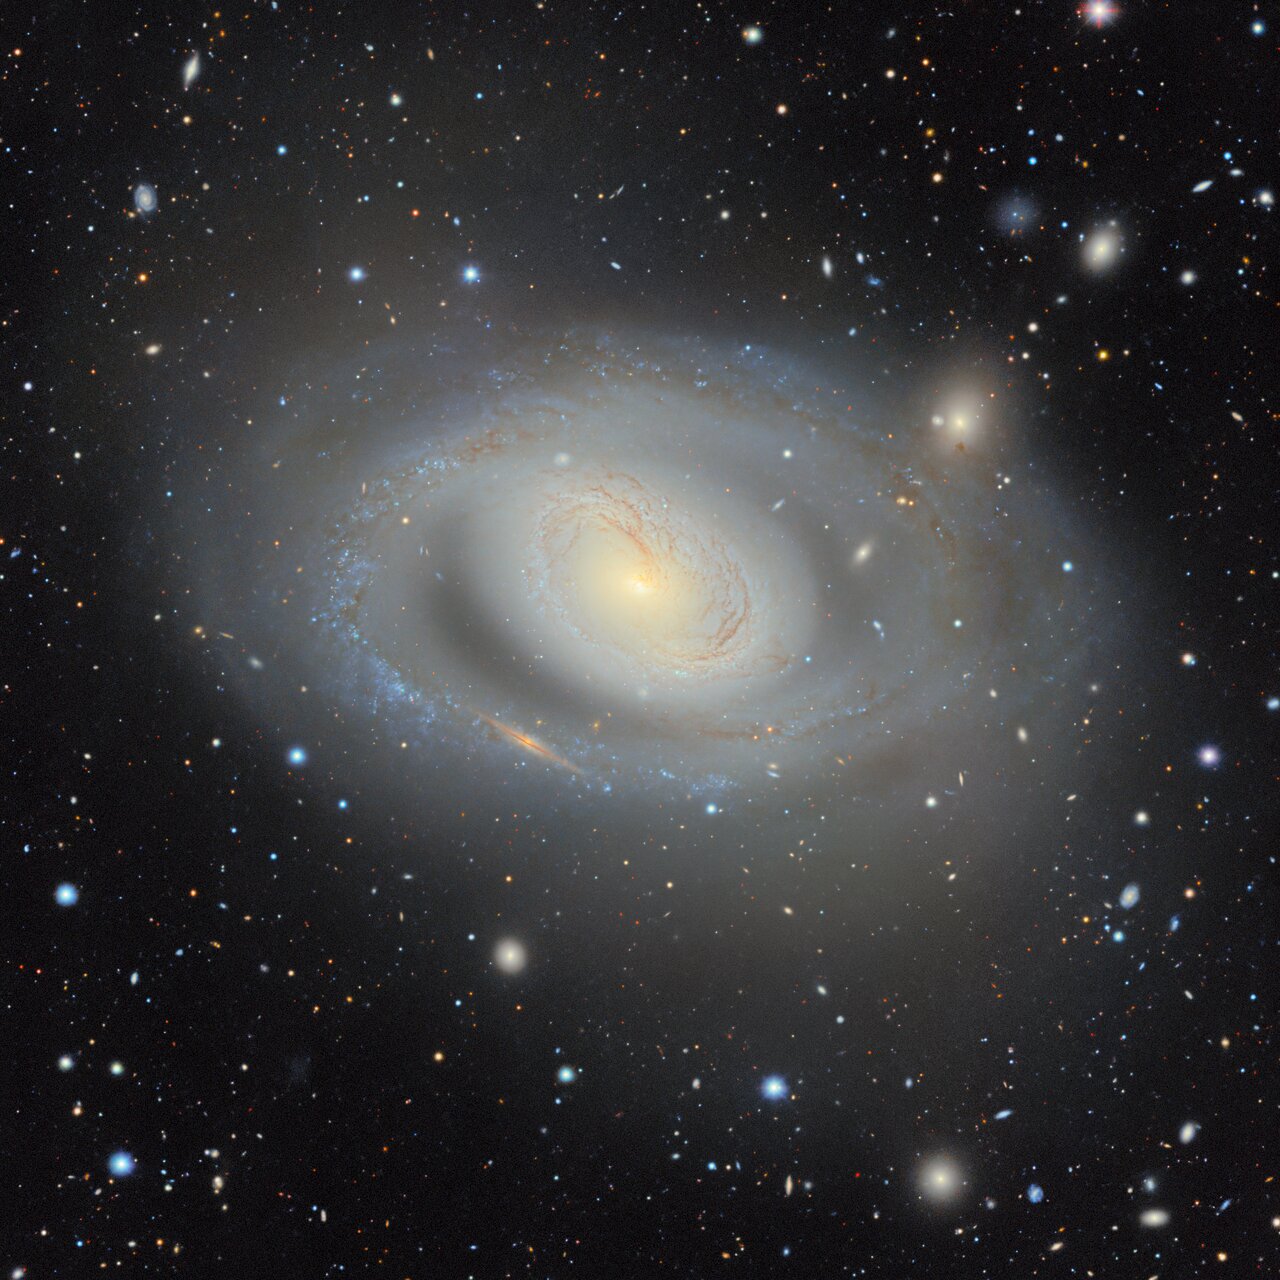
Scientists have pointed telescopes at the sky and mapped the cosmos for centuries. That relentless pursuit is producing maps that are bigger and more detailed than ever. But there’s one map that stands out above the rest, and now it’s the largest 2D map of the night sky ever created.
The best part? Anyone can play with it.
The map, called Data Release 11 or DR11, comes courtesy of the DESI Legacy Imaging Surveys team at NSF NOIRLab, headquartered in Tucson, Arizona, with contributions from the Lawrence Berkeley National Laboratory in California and other agencies and organizations.
Covering 75% of the sky across 5.6 trillion pixels, DR11 is the team’s most comprehensive map to date, built upon prior versions of the same map . It expands on DR9 by 50% and brings back northern sky coverage missing from DR10. Based on 263,407 ground-based exposures by 160 scientists, the map catalogs 4 billion objects — including stars, galaxies, black holes and asteroids — in visible and near-infrared light.
Already cited in over 1,800 research papers, NOIRLab expects this to remain the premier 2D map of its kind for years. According to co-lead David Schlegel, it also laid the groundwork for identifying 60 million targets for the DESI project and for building a full 3D map, which was completed in 2026. With billions of targets still unstudied, Schlegel told CNET that “plenty of other discoveries” remain hidden in plain sight for public exploration.
Enough talk, let’s play
The map doesn’t look like much at first. But if you pick a spot and start zooming in, you can get a pretty good idea of how vast it really is. What appears to be a cloud of pretty colors is actually billions of objects floating around in space.
You might notice that DR11, which is designed to see out into the universe, doesn’t contain any planets, moons or asteroids within our solar system. That may be a little bit of a bummer for some, but there are plenty of other objects to look for.
Though the user interface is a little overwhelming at first, you really only need four boxes to play around — and all four of them are right next to each other in the bottom-left corner.
Zoom: This indicates how zoomed in you are based on the +/- slider on the top left. It goes from degrees to arc minutes and then finally to arc seconds. I got most of my best results between 20 and 50 arc minutes.
Contrast and brightness: Below zoom, you’ll find the contrast slider, which reduces the background noise of the map. Under that, the brightness slider helps illuminate smaller objects. Adjust these settings as needed to get the best view, but start with the defaults.
Jump to object: This is the most important box, where you can type in the names of celestial bodies to find them on the map. I searched for a couple dozen celestial objects, and found them all pretty quickly. Online lists of named black holes, quasars and other cool celestial bodies can be a good starting point in exploring the universe — I have more tips for finding them if you keep reading.
Once you land on something, use the zoom slider in the top-left corner to zoom in and get a closer look. (Don’t use your mouse wheel for this because it zooms in wherever your pointer is, potentially taking you to a completely different part of the map.) You can also drag the cursor around the screen to view everything around the object you’re looking at.
A sky like you’ve never seen it
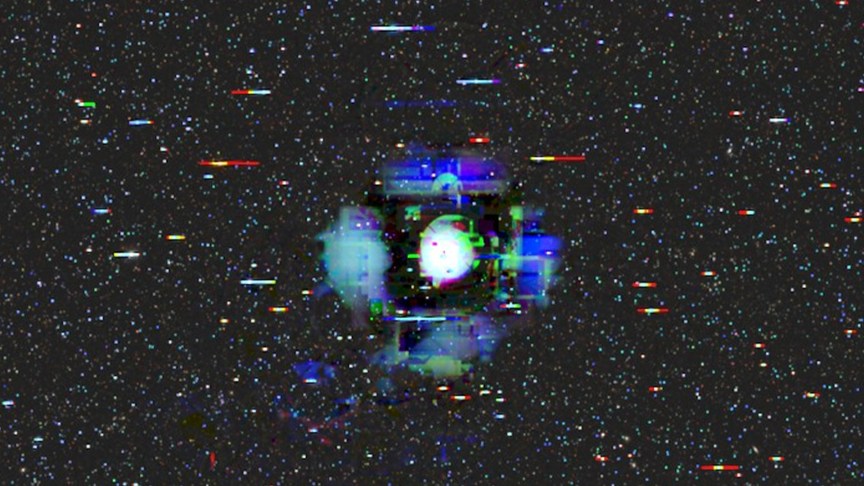
My first visit on the map was to Arcturus, the fourth-largest star in the sky. Zoomed in, it’s much larger than every other object around it by a rather wide margin, which is why it’s so easy to find in the night sky.
Another search took me to LHS 1140b, the first star ever discovered that sits in another star’s habitable zone with an atmosphere. This one is much smaller than Arcturus and required me to zoom in to 30 arc seconds to see it. It’s quite close to its host star, which makes sense since the habitable zone is pretty close to the star itself. Earth would appear at a similar distance from the sun if viewed from this perspective.
The star that LHS 1140b orbits is also dimmer than many other stars. It’s about 20% the size of the sun, so it almost looks like a big planet rather than a small star.
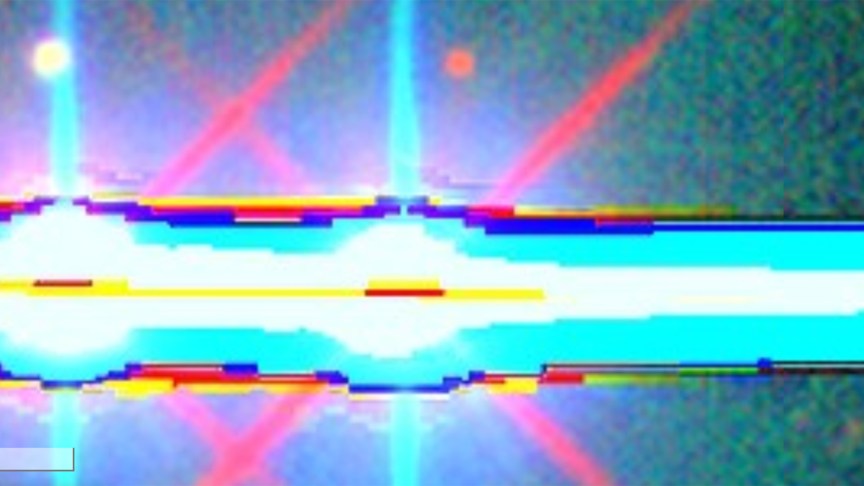
Some stuff is easier to find than others. For example, planet HD 80606 b is so close to its star that it is absolutely scorched, with temperature swings of 1,100 degrees Fahrenheit. Bright glare from its binary stars completely obscures HD 80606 b on the map. It’s still there, though, getting blasted by its star like a blowtorch caramelizing sugar on the top of a crème brûlée.
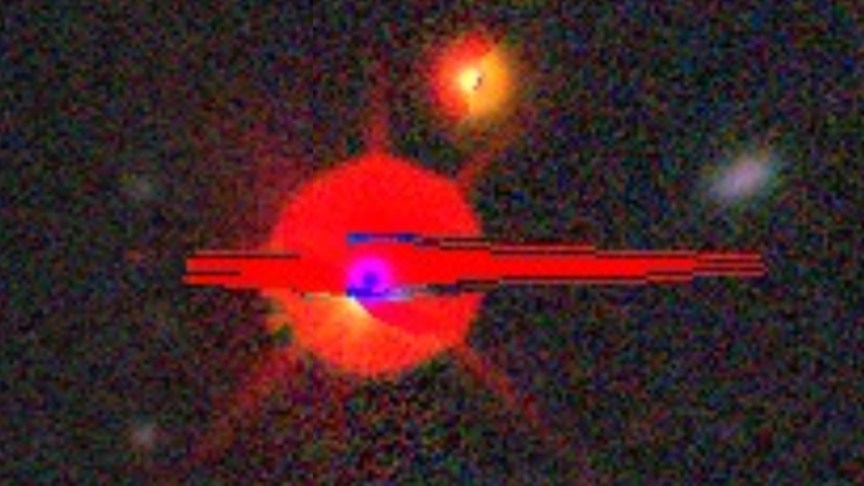
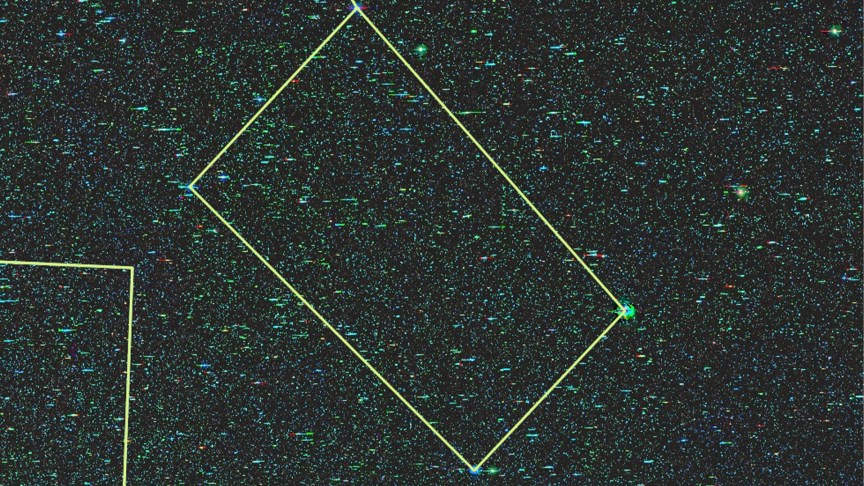
You’ll notice that the map has a large, sweeping blank spot running through it. These are the parts of the sky that haven’t been mapped yet. Researchers say that this is due to various obstacles, such as space dust, bright stars getting in the way of scans and black holes covering everything behind them.
For example, try searching for Sagittarius A*, the supermassive black hole at the center of the Milky Way. The map shows you where it is — right inside one of those blank bands. The black hole prevents any telescope from seeing the stars and planets behind it, so that part of the map remains blank.
More advanced options
You’ll also see a box with a ton of options in the top-right corner of the map. For basic viewing, you don’t have to interact with this box at all, but there are some fun things in there if you want to see them.
Images: This dropdown menu lets you select which set of images you want to use. Leave that on Legacy Surveys DR11 because that’s the most recent dataset.
Overlays: This menu is more complicated, as it includes a lot of different datasets you can overlay. Many of them just show which telescopes, instruments and surveys found each separate part of the map. You can leave them all off and still search around the universe for cool stuff.
However, there is one set of overlays that is worth your time: the Bright objects overlay, with options that actually help you navigate the map. For example, the Bright stars option will put blue circles around the brightest stars on the map with names, making them much easier to find. That’s how I learned that the designation for Arcturus is HR 5340.
Bright objects include star clusters, planetary nebulae and some more specific ones — but the most fun is the Constellations overlay, which shows off every constellation in the sky. If you toggle it on, pick a constellation and zoom into each corner and point, you can find the bright stars that humans used to construct these constellations ages ago.
Finding stuff to search for
The real challenge in using the DR11 app is figuring out what to look up. There are all sorts of celestial bodies, and many of them have some pretty cool stories. However, there really isn’t much of a repository to find these things.
We know AI isn’t great at many things, but Schlegel suggested that a large language model may be pretty good for this application since it can scan the web quickly.
This isn’t without its caveats. Schlegel said that Google Gemini tends to “spit out sexagesimal coordinates” that don’t work in the map’s viewer website because they’re an archaic sky-mapping system. However, Anthropic’s Claude uses decimal-degree coordinates, which work. While the team is looking into supporting both, Schlegel said he prefers the newer decimal system over the archaic system originally invented by Hipparchus and Ptolemy.
The team also gave CNET a list of some pretty neat stuff to look up in the map viewer if you need more ideas. These are some of the most gorgeous pieces of imagery on the entire map:
- NGC 5272 – The Globular Cluster
- NGC 4826 – The Black Eye Galaxy
- NGC 3351 – The Barred Spiral Galaxy
- NGC 4486 – Virgo A
- NGC 5457 – The Pinwheel Galaxy
- NGC 4594 – Sombrero Galaxy
Schlegel also recommended visiting an FAQ web page for more granular guidance on using the search and overlay functions to improve your experience.

See full bio
Read the full article here